


Desmos Graphing Calculator
4.61.72K Reviews
App Specs
- Version
- 7.58.0.0
- Updated On
- License
- Free
- Downloads
- 10,000,000+
- Developer
- Desmos Inc
- Categories
- Education
- Platform
- Android, iOS
Screenshots
 Analysis by AppCompare
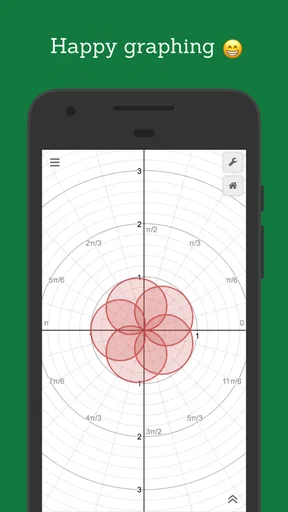
I keep coming back to Desmos Graphing Calculator because it makes a difficult part of mathematics feel visible. Instead of treating an equation as a string of symbols that must be manipulated on paper, I can enter it, see its curve, change a value, and immediately watch the result move. That direct connection between an expression and its graph is the app’s real strength. It is not merely a digital replacement for a handheld calculator; it is a practical visual workspace for exploring relationships.
Desmos Graphing Calculator is a free education app from Desmos Inc, aimed at everyone from students meeting functions for the first time to teachers and technically minded users checking a model. It has earned a 4.6 average from around 36 thousand ratings, with more than 10 million installs, which matches my impression that it has become a familiar tool in classrooms and study sessions. I think it is especially good when the question is “what happens if I change this?” rather than simply “what is the answer?”
Why the graph is more useful than a bare answer
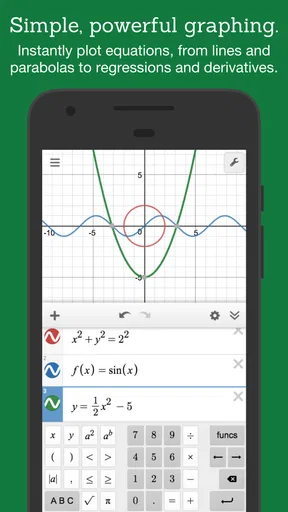
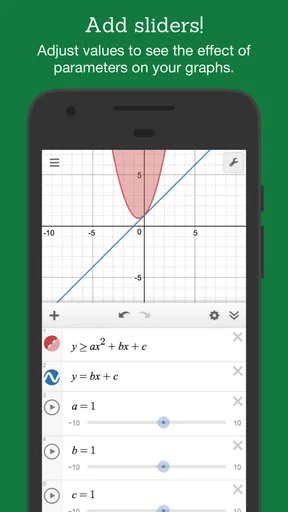
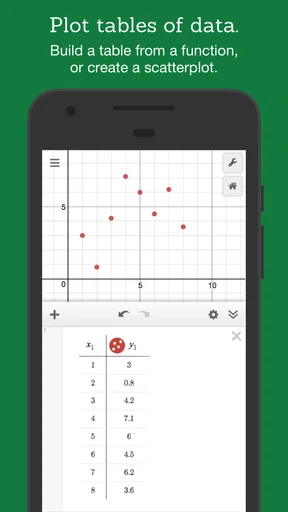
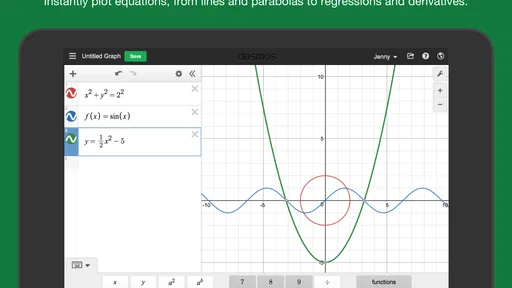
The main screen is built around a list of expressions and a graphing area. I can type a function, add another one for comparison, and use the visual result to understand intersections, transformations, and trends. Tables are useful when I want to inspect exact values instead of relying only on the curve. Sliders make the experience more experimental: I can attach a variable to a coefficient or constant, move it, and see how the graph responds.
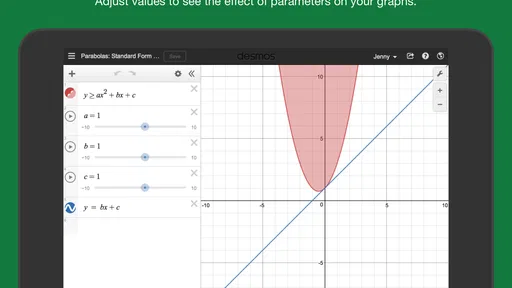
That workflow is simple enough for a quick calculation but deep enough for genuine investigation. For example, when studying a quadratic, I can alter the coefficient of the squared term and observe the change in width, then adjust the linear term and watch the turning point shift. The graph gives me a reason to predict before I calculate. In my experience, that is where the app becomes more than a convenient answer machine.
The strongest reason to use Desmos is the instant visual feedback between algebra and geometry. A mistake in an equation often becomes obvious because the curve looks wrong. A sign error that might survive several lines of handwritten work stands out when a line slopes in the opposite direction or an expected intersection disappears. I still need mathematical judgement, but the app gives me a fast way to test that judgement.
A practical study session
Imagine I am revising simultaneous equations after dinner. I enter both lines, inspect where they cross, and then use the table to check nearby values. If my algebra produces a pair of coordinates that does not sit on the visible intersection, I know I need to revisit the working rather than memorise a suspicious result. I can then change one constant with a slider and see how the solution moves. That small experiment often teaches more than completing another identical exercise.
The same approach works for inequalities and domains. I can shade or restrict a graph to examine the part that matters, rather than drawing a rough sketch and hoping the boundary is correct. When working with a piecewise rule, I can place the separate expressions on the same graph and inspect how they meet. The visual layout helps me notice continuity, gaps, and sudden changes that are easy to miss in a notebook.
Worth Reading Before You Choose

EA SPORTS FC Mobile 26 Is a Bigger Football Game, but It Takes Time

Flipboard Shows What News Apps Must Do Beyond the Feed

Switching to Android Auto Means Rethinking Your Driving Routine

Google Calendar Makes a Crowded Week Easier to Manage

Ludo King Makes the Most of the Minutes Between Plans

Baby Panda World Brings Quick Play to Modern Phones, but Its Game Library Feels Busy
Another useful habit is to keep related expressions together. I might enter an original function, its transformed version, and a reference line in the same list. Turning individual expressions on and off lets me isolate the effect of each change. This is more efficient than repeatedly clearing the screen, and it encourages comparison instead of treating every exercise as an isolated calculation.
Sliders turn formulas into experiments
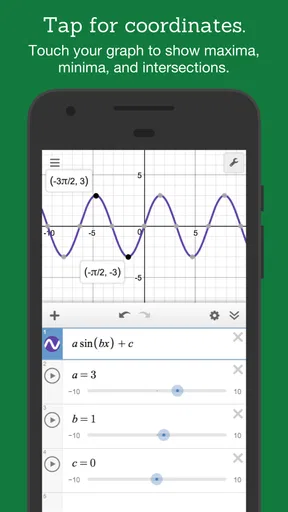
Sliders are one of the most valuable features for learning, but they are also easy to use superficially. I get the most from them when I first make a prediction. If I create a family such as a line with a variable slope, I try to describe the expected movement before dragging the control. Then I change the value slowly and compare the result with my prediction. This turns a visual control into a way of testing a mathematical idea.
There is a useful trade-off here. A slider can reveal a pattern quickly, but it can also encourage passive watching. If I simply move it until the graph looks familiar, I may remember the animation without understanding the rule. I recommend writing down the relationship in words or symbols before experimenting. Desmos makes the experiment easy; the learner still has to do the thinking.
Sliders are also helpful for explaining parameters to another person. A teacher can demonstrate how changing a coefficient affects a family of curves, while a student can use the same setup to prepare a short explanation. Even without turning the app into a formal lesson, the moving graph gives a clear shared reference point during discussion.
Tables, intersections, and checking work
The table view deserves more attention than it usually gets. A graph is excellent for shape and position, but a table is better when I need to inspect inputs and outputs in a controlled way. I can use it to check whether a function behaves as expected at selected values, compare two expressions row by row, or look for a numerical pattern before trying to prove it.
I also find the combination of graph and table useful when an answer is approximate. The curve may show that two functions meet somewhere in a particular region, while the table helps me narrow down the values I want to investigate. That does not replace an exact algebraic solution when one is required, but it gives me a sensible way to verify whether my exact result is plausible.
For a student, this distinction matters. Desmos can show a likely answer quickly, yet a school assignment may require the method. I would use the app after attempting the problem, not as a substitute for the working. It is excellent at checking a model and exposing a misconception, but it cannot decide whether my algebraic explanation is logically complete.
Where the experience feels less comfortable
The biggest weakness is that the app’s simplicity can become limiting when a problem needs a long, carefully organised derivation. The expression list is excellent for graphing, but it is not a full mathematical notebook. I can enter formulas and compare results, yet I would not choose it for writing a multi-step proof, explaining every algebraic transformation, or keeping extensive classroom notes.
There is also a learning curve hidden beneath the clean interface. A first-time user may understand how to draw a line but still wonder how to restrict a domain, build a useful table, or make a slider represent the right parameter. The app does not feel cluttered, which I appreciate, but that means some of its more powerful habits are discovered through practice rather than obvious visual prompts.
Another limitation is precision of interpretation. A graph can look convincing while hiding an important detail: a narrow feature, an excluded endpoint, or a function that changes rapidly over a small interval. I have to adjust the viewing window and inspect values rather than trusting the first picture. The app makes zooming and exploration convenient, but it does not protect me from reading too much into a rough visual impression.
That is why I would not recommend using it alone for every kind of mathematics. If I need symbolic simplification, a structured equation-solving environment may be more appropriate. If I need formal handwritten-style working, paper or a dedicated note-taking tool is better. If I want a broad scientific calculator with many specialised modes, a conventional calculator app may be faster. Desmos wins when the graph itself is central to the question.
Who gets the most from it
I think the best audience is anyone learning or using functions, equations, coordinate geometry, statistics, or mathematical modelling. Secondary-school students can use it to connect formulas with shapes. University students may appreciate it for quick visual checks before moving to more specialised software. Teachers can use it to construct demonstrations, compare cases, and make abstract changes visible.
It is also a good choice for curious learners who do not have a specific worksheet in front of them. I can enter a familiar function, change its parameters, and investigate what remains constant. That kind of open-ended exploration is difficult with a basic calculator because the calculator returns values but does not show the broader relationship.
On the other hand, I would suggest caution for someone who wants an all-purpose study organiser. This is an education app focused on graphical mathematics, not a general lesson platform. It will not replace a textbook, a tutor, or a system for recording explanations. A learner who dislikes visual reasoning may also find that the graph answers “where” and “how it changes” more readily than “why the algebraic method works.”
The age rating is Everyone, and I can see why: the interface is approachable and the subject matter is suitable for a wide range of users. Still, suitability depends more on mathematical level than age. A young learner may enjoy moving sliders without understanding them, while an older student may need guidance on interpreting the result. The tool is accessible; the quality of the learning depends on how deliberately it is used.
Everyday uses beyond homework
I would use the app for more than textbook exercises. If I were comparing two mobile data plans, for instance, I could represent a fixed starting cost and a per-unit charge as lines, then inspect where the options become equal. The same structure applies to delivery fees, taxi pricing, break-even questions, and simple budgeting models. The point is not that Desmos makes the decision automatically; it lets me see the point at which one relationship overtakes another.
It is equally useful for checking a design or measurement idea. Suppose I want to understand how the height of an object changes over time in a simplified model. I can graph the formula, identify the interval that makes physical sense, and mark important values. The ability to limit attention to a meaningful domain prevents me from treating every mathematically possible part of a curve as a realistic prediction.
For statistics, I can use tables and graphs to inspect data-related relationships, though I would choose a more specialised tool if I needed a complete data-analysis workflow. Desmos is strongest when I want an immediate visual connection between values and a mathematical expression. It is less suitable when the work involves extensive data cleaning, reporting, or document production.
What to know before relying on it
The app is free, which removes the most obvious barrier to trying it. Desmos Inc has maintained a focused product rather than turning the experience into a crowded collection of unrelated tools. The current version is 7.58.0.0, and the app requires operating-system version 10 or later. That requirement is worth checking before planning to use it on an older device, especially in a school setting where hardware may be mixed.
I would also set expectations about the role of a graphing calculator in assessment. In some classes, using a visual tool is encouraged for exploration but not accepted as evidence of method. In others, the graph may be exactly what the task requires. I recommend solving a few examples by hand, then using Desmos to test the result and investigate variations. That balance prevents the app from becoming a shortcut that weakens core skills.
One of my favourite workflows is to build the simplest version of a problem first. I enter the base function, check its shape, and only then add restrictions, parameters, or comparison expressions. This makes errors easier to locate. If I enter everything at once and the graph looks unexpected, I have too many possible causes. A staged setup is faster in practice and teaches me which part of the model is responsible for each visual change.
I also recommend naming or visually organising expressions when a graph becomes busy, and hiding reference curves once they have served their purpose. The value of the app comes partly from reducing mental clutter. A screen filled with overlapping lines can be less informative than a carefully selected pair, even when every expression is correct.
My final recommendation
After using Desmos Graphing Calculator as both a quick checker and an exploratory mathematics tool, I see it as one of the clearest options for understanding functions visually. Its strongest feature is not simply that it draws graphs quickly. It lets me connect equations, tables, parameters, and visible changes in one place, which makes abstract ideas easier to test and discuss.
It is not the right choice for every mathematical task. I would pair it with paper, a symbolic tool, or a specialised calculator when the work demands formal derivations, extensive data handling, or a broad collection of scientific functions. I would also avoid treating a graph as proof without checking the underlying values and reasoning.
For students, teachers, and curious learners who want to see what an equation is doing, I recommend installing it. The free price makes experimentation easy, the Everyone rating keeps it broadly approachable, and its large community of users reflects how useful the basic idea has become. Use it to ask better mathematical questions, not just to obtain faster answers. That is where this app earns its place on my device.
Pros
- Plots functions
- inequalities
- points
- and tables accurately.
- Interactive sliders make exploring equations quick and intuitive.
- Supports multiple expressions on the same graph.
- Works well for learning algebra
- geometry
- and calculus concepts.
- Free to use with no account required for basic graphing.
Cons
- Advanced features can take time for beginners to discover.
- Large graphs may feel crowded when many expressions are displayed.
- Some classroom activities require an internet connection.
- Limited symbolic algebra compared with dedicated computer algebra apps.
- Small-screen editing can be less comfortable on phones than tablets.
FAQs for Desmos Graphing Calculator
What is Desmos Graphing Calculator used for?
Desmos Graphing Calculator is an interactive mathematics tool for plotting equations, exploring functions, and visualizing data. After testing it, I found it especially useful for algebra, trigonometry, calculus, statistics, and geometry practice. You can enter equations, create tables, add sliders, plot points, and compare multiple graphs at once, making abstract mathematical concepts easier to understand.
Is Desmos Graphing Calculator free to download and use?
Yes, the standard Desmos Graphing Calculator is generally available free of charge on supported Android and iOS devices, as well as through a web browser. Most of its core graphing features can be used without paying. However, availability and specific features may vary by platform or account type, so checking the official app store listing is recommended before downloading.
Does Desmos work without an internet connection?
Desmos can be useful offline, but offline functionality may depend on the version installed and the device being used. Basic graphing may remain available after the app has loaded, while features involving account synchronization, saved cloud activities, sharing, or online classroom content may require internet access. If you need it for school or travel, test offline access beforehand.
Can beginners use Desmos Graphing Calculator easily?
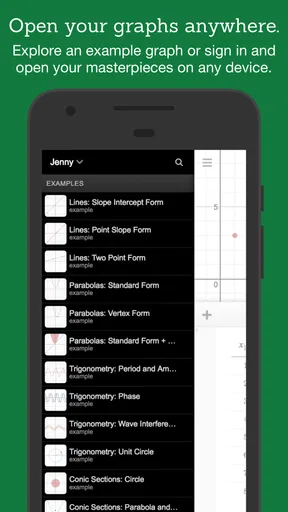
Yes, beginners can learn the basics fairly quickly because the interface is clean and responsive. You simply type an expression and the graph appears immediately, while sliders and menus encourage experimentation. That said, some advanced functions, regression tools, restrictions, and settings may require practice. New users should explore the built-in examples or start with simple linear and quadratic equations.
What are the main limitations of Desmos Graphing Calculator?
Desmos is excellent for visualizing mathematics, but it is not a complete replacement for every type of calculator or computer algebra system. It may not provide detailed, step-by-step solutions for all problems, and some advanced symbolic calculations are limited. Users should also verify results independently, especially in graded work, because graphing a function does not always explain the underlying method.


